The 7002.28 Warning
The U.S. Liquidity Heart Attack That May Trigger an Equity Crash

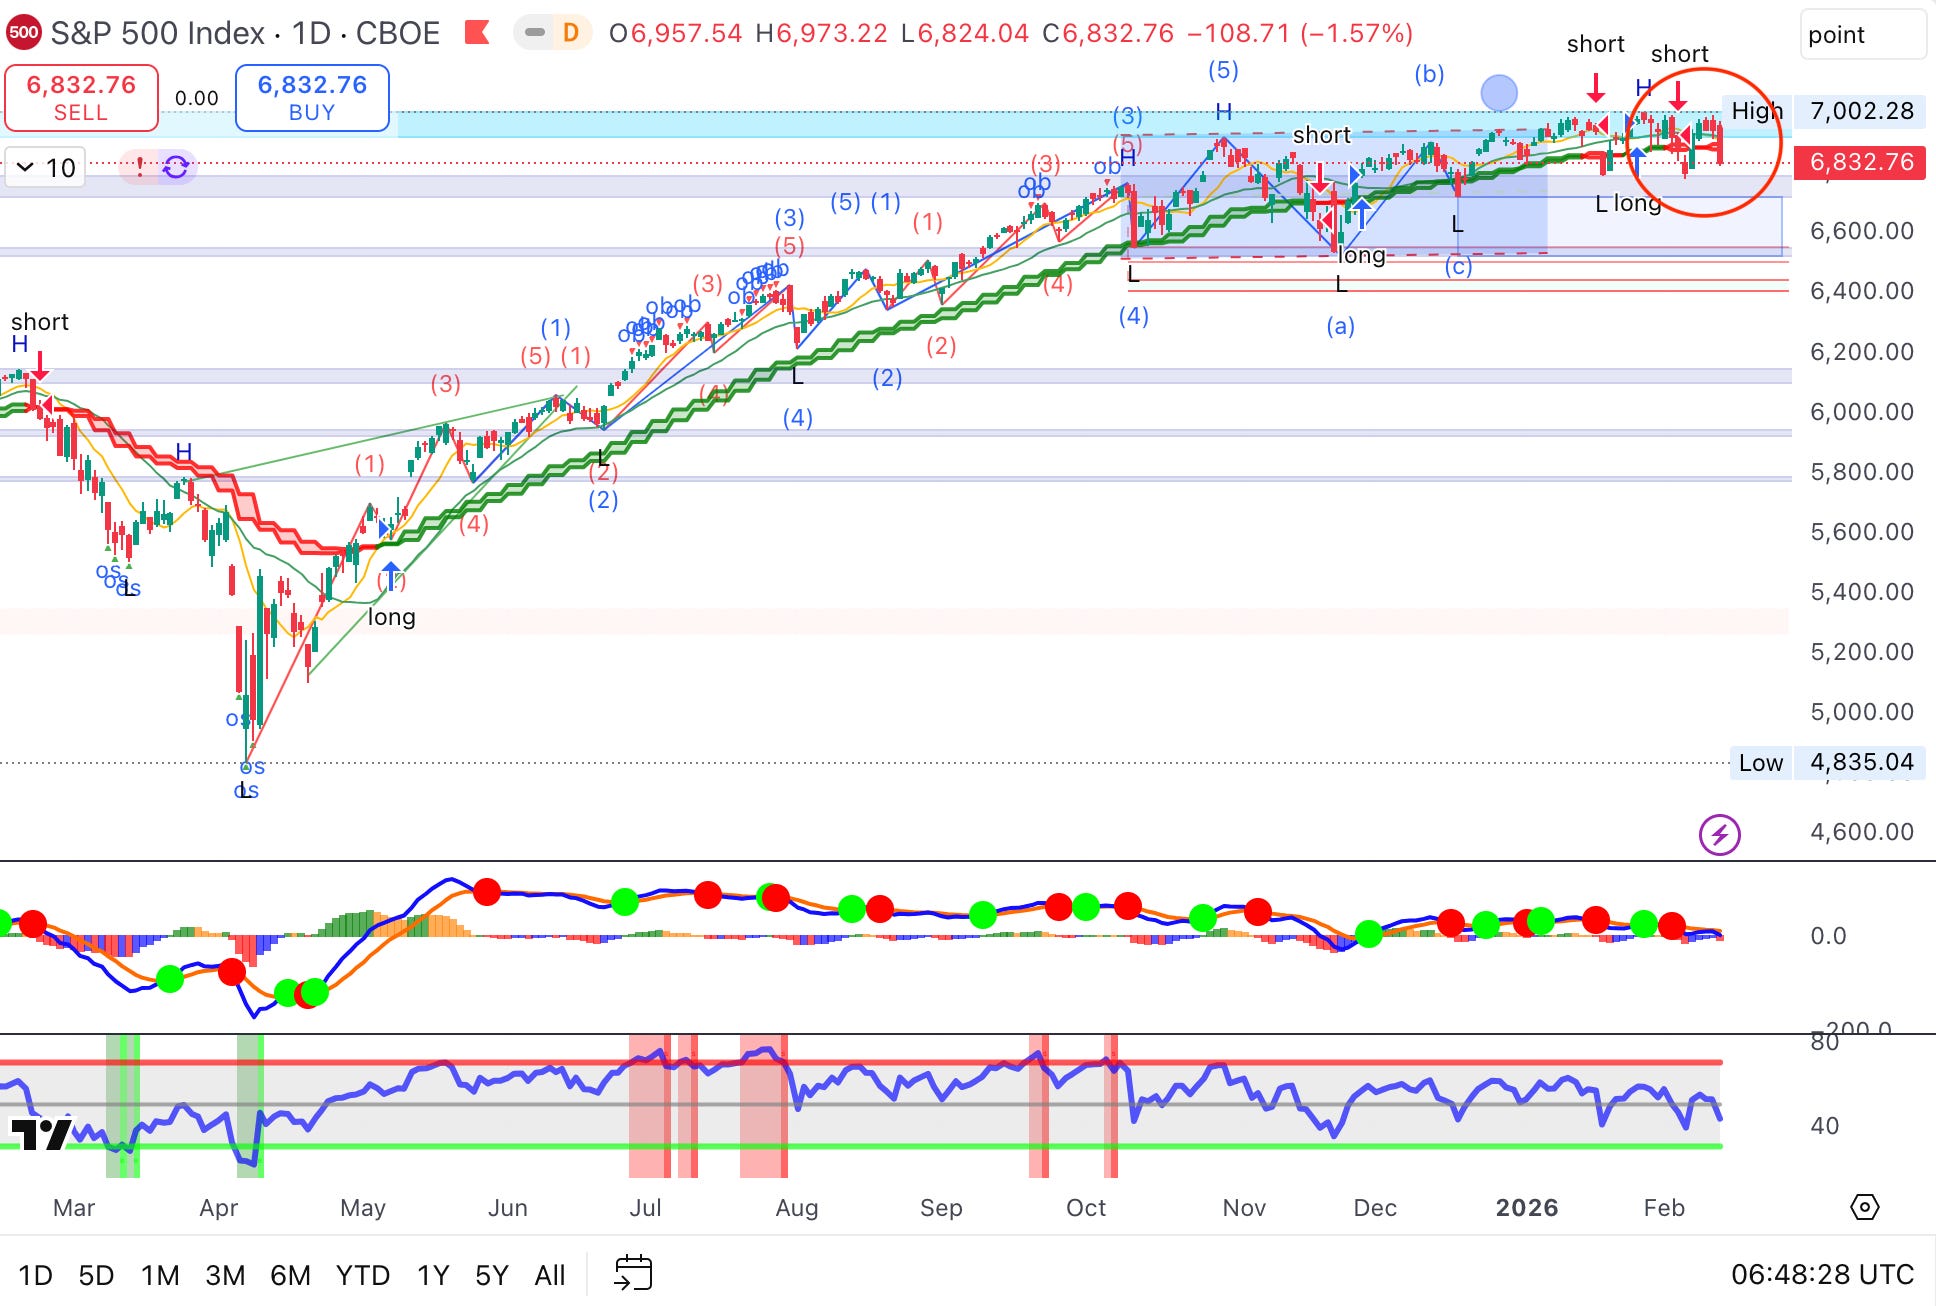
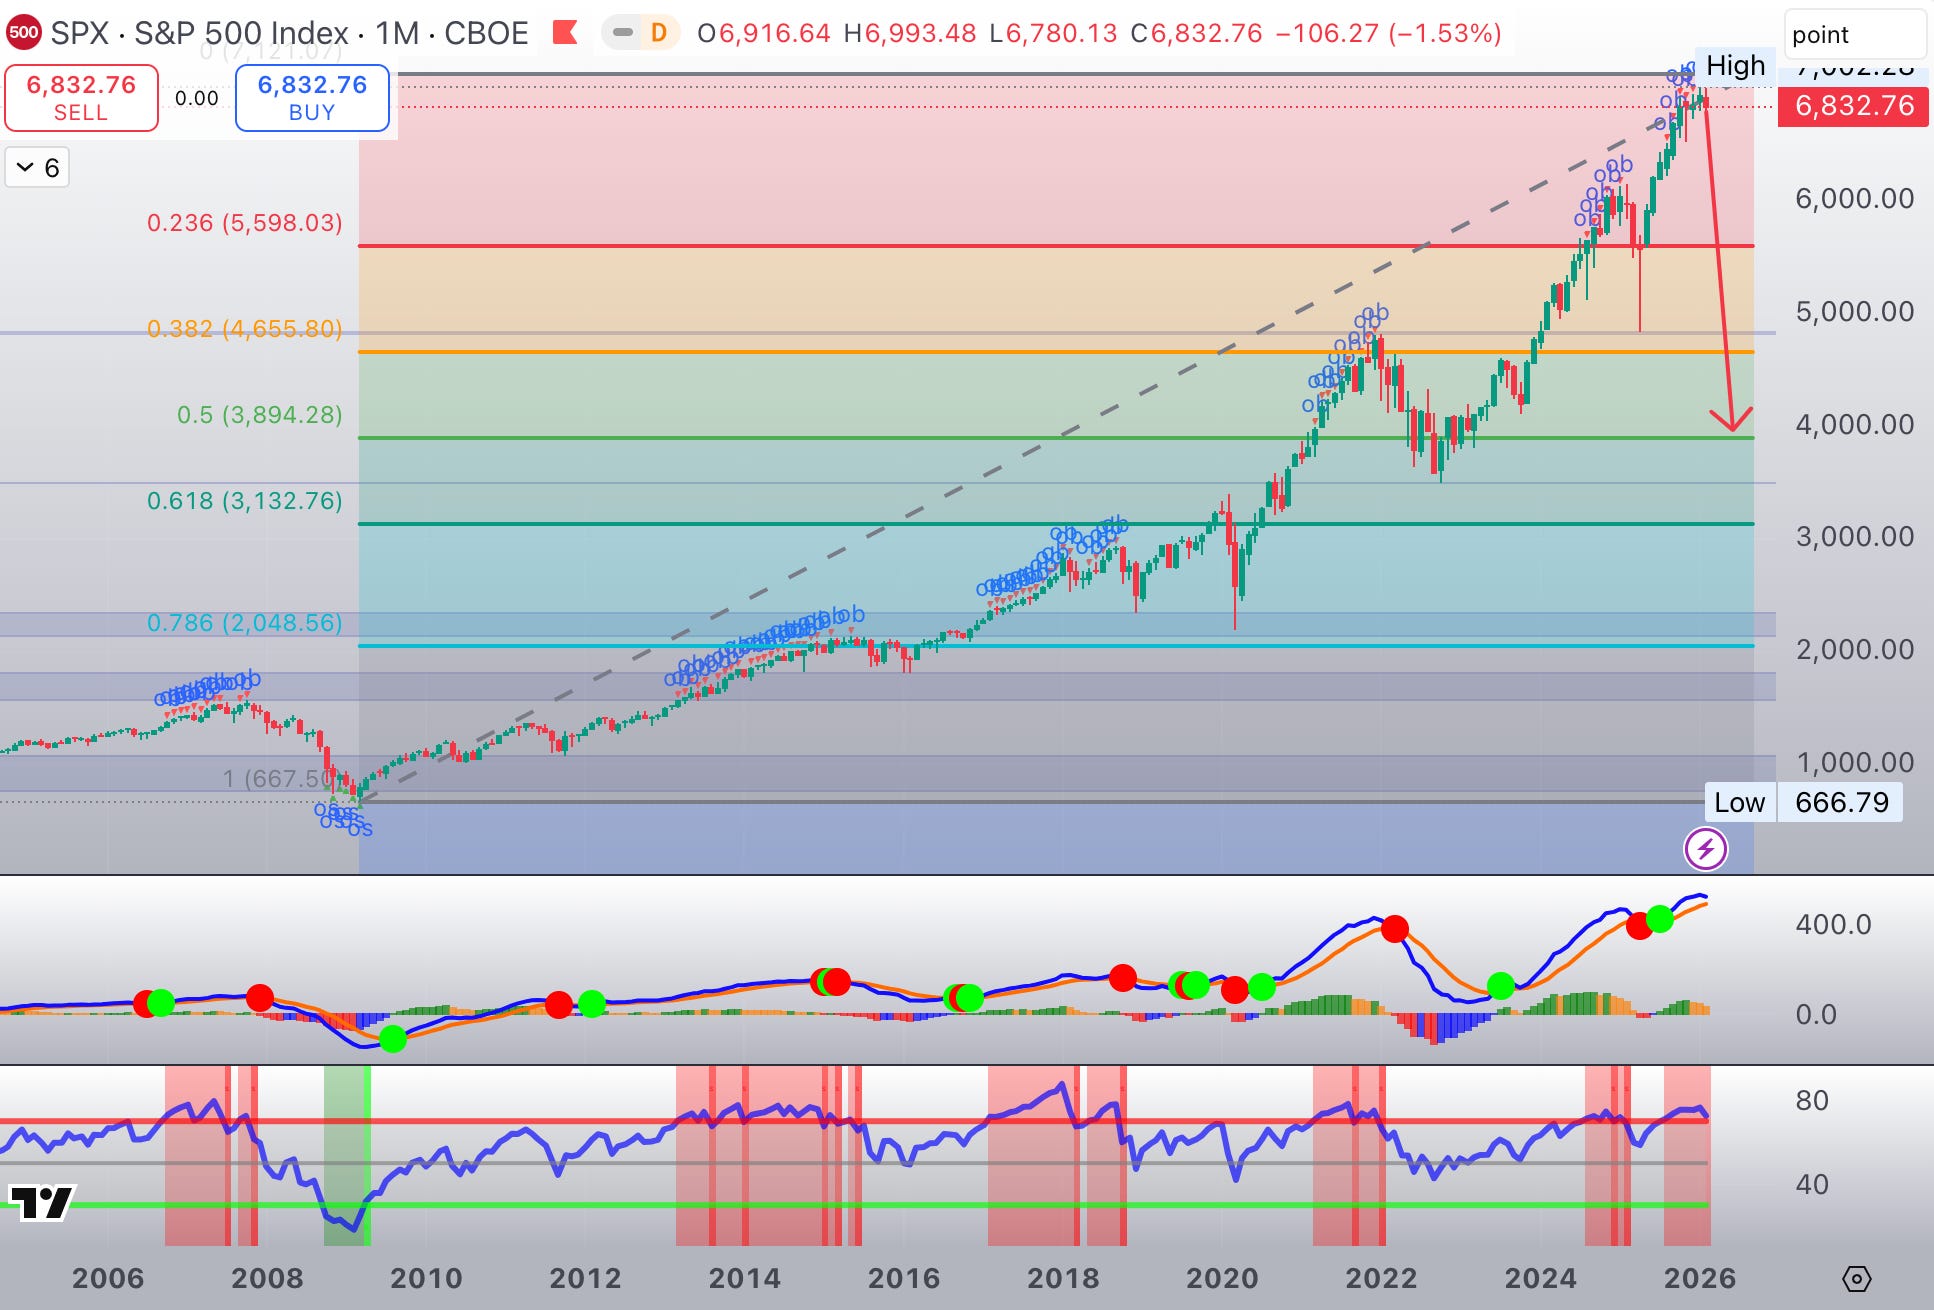
On January 28th, 2026, the S&P 500 briefly crossed the 7,000 threshold for the first time in history, printing an all-time high at 7,002.28 before swiftly reversing.
Round numbers are, in theory, just numbers.
In practice, they are psychological landmarks.
They are not technical targets.
They are mental reference points — levels investors, strategists, and allocators project, internalize, and anchor to long before they are reached.
When such landmarks are finally touched, an implicit warning is triggered in every serious analytical framework:
“And now?”
Three Secular Bull Markets Ending at Once
In our previous work, we have repeatedly outlined our long-standing structural view on U.S. equities, Big Tech, and the AI-driven bubble.
Our central thesis has been consistent:
We are completing the peaks of THREE secular bull markets simultaneously — an exceptionally rare historical configuration.
The bull market that began in March 2020
The bull market that began in March 2009
The super-cycle that began in 1932, in the depths of the Great Depression following the 1929 crash
The convergence of these three cycles has produced something unprecedented.
The Most Extended Ending Diagonal in Market History
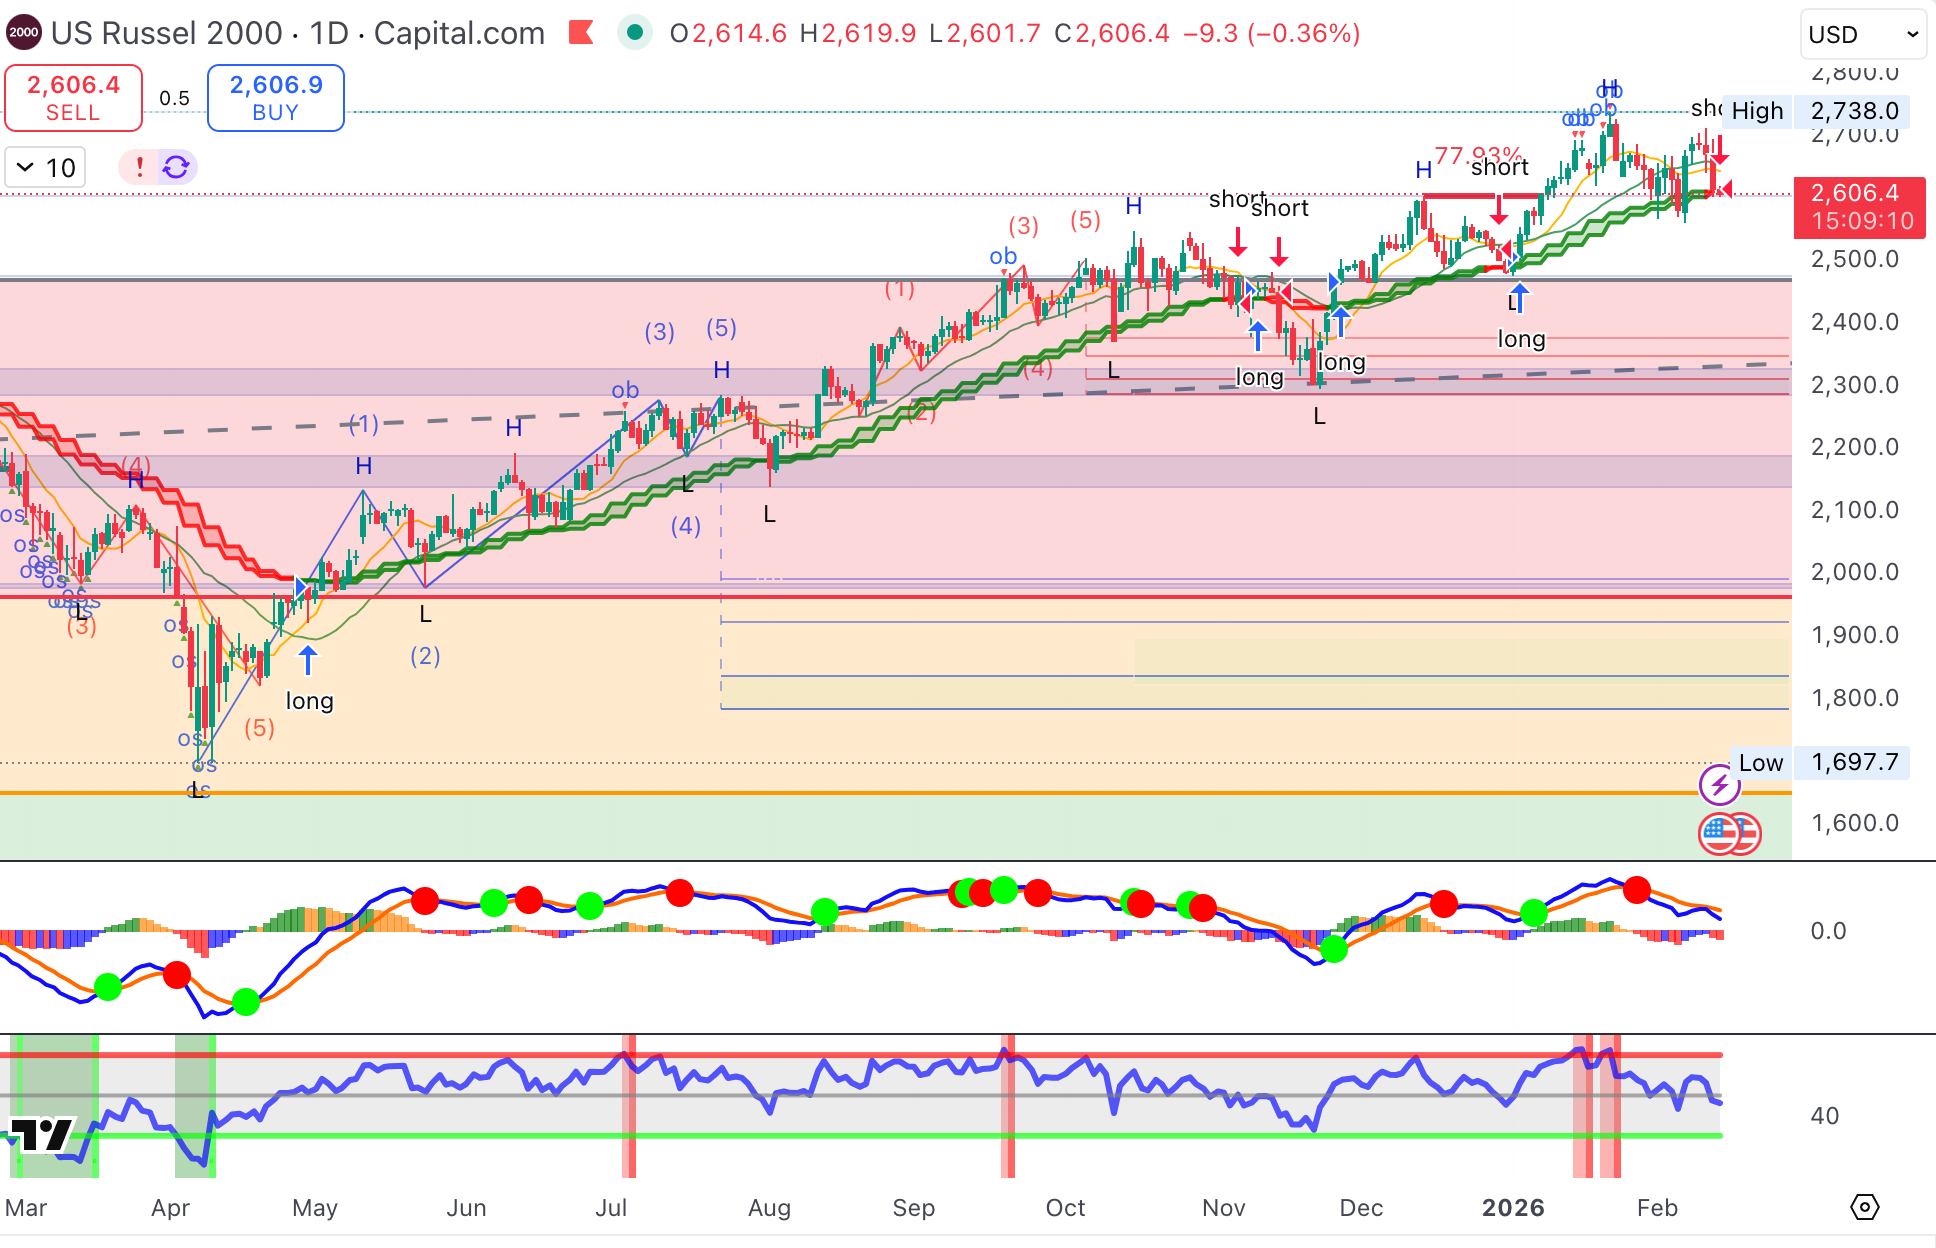
The final phase of this secular advance — roughly April 2025 to February 2026 — has evolved into what can only be described as the most extended ending diagonal ever recorded.
In less than one year:
The S&P 500 surged +45.7%
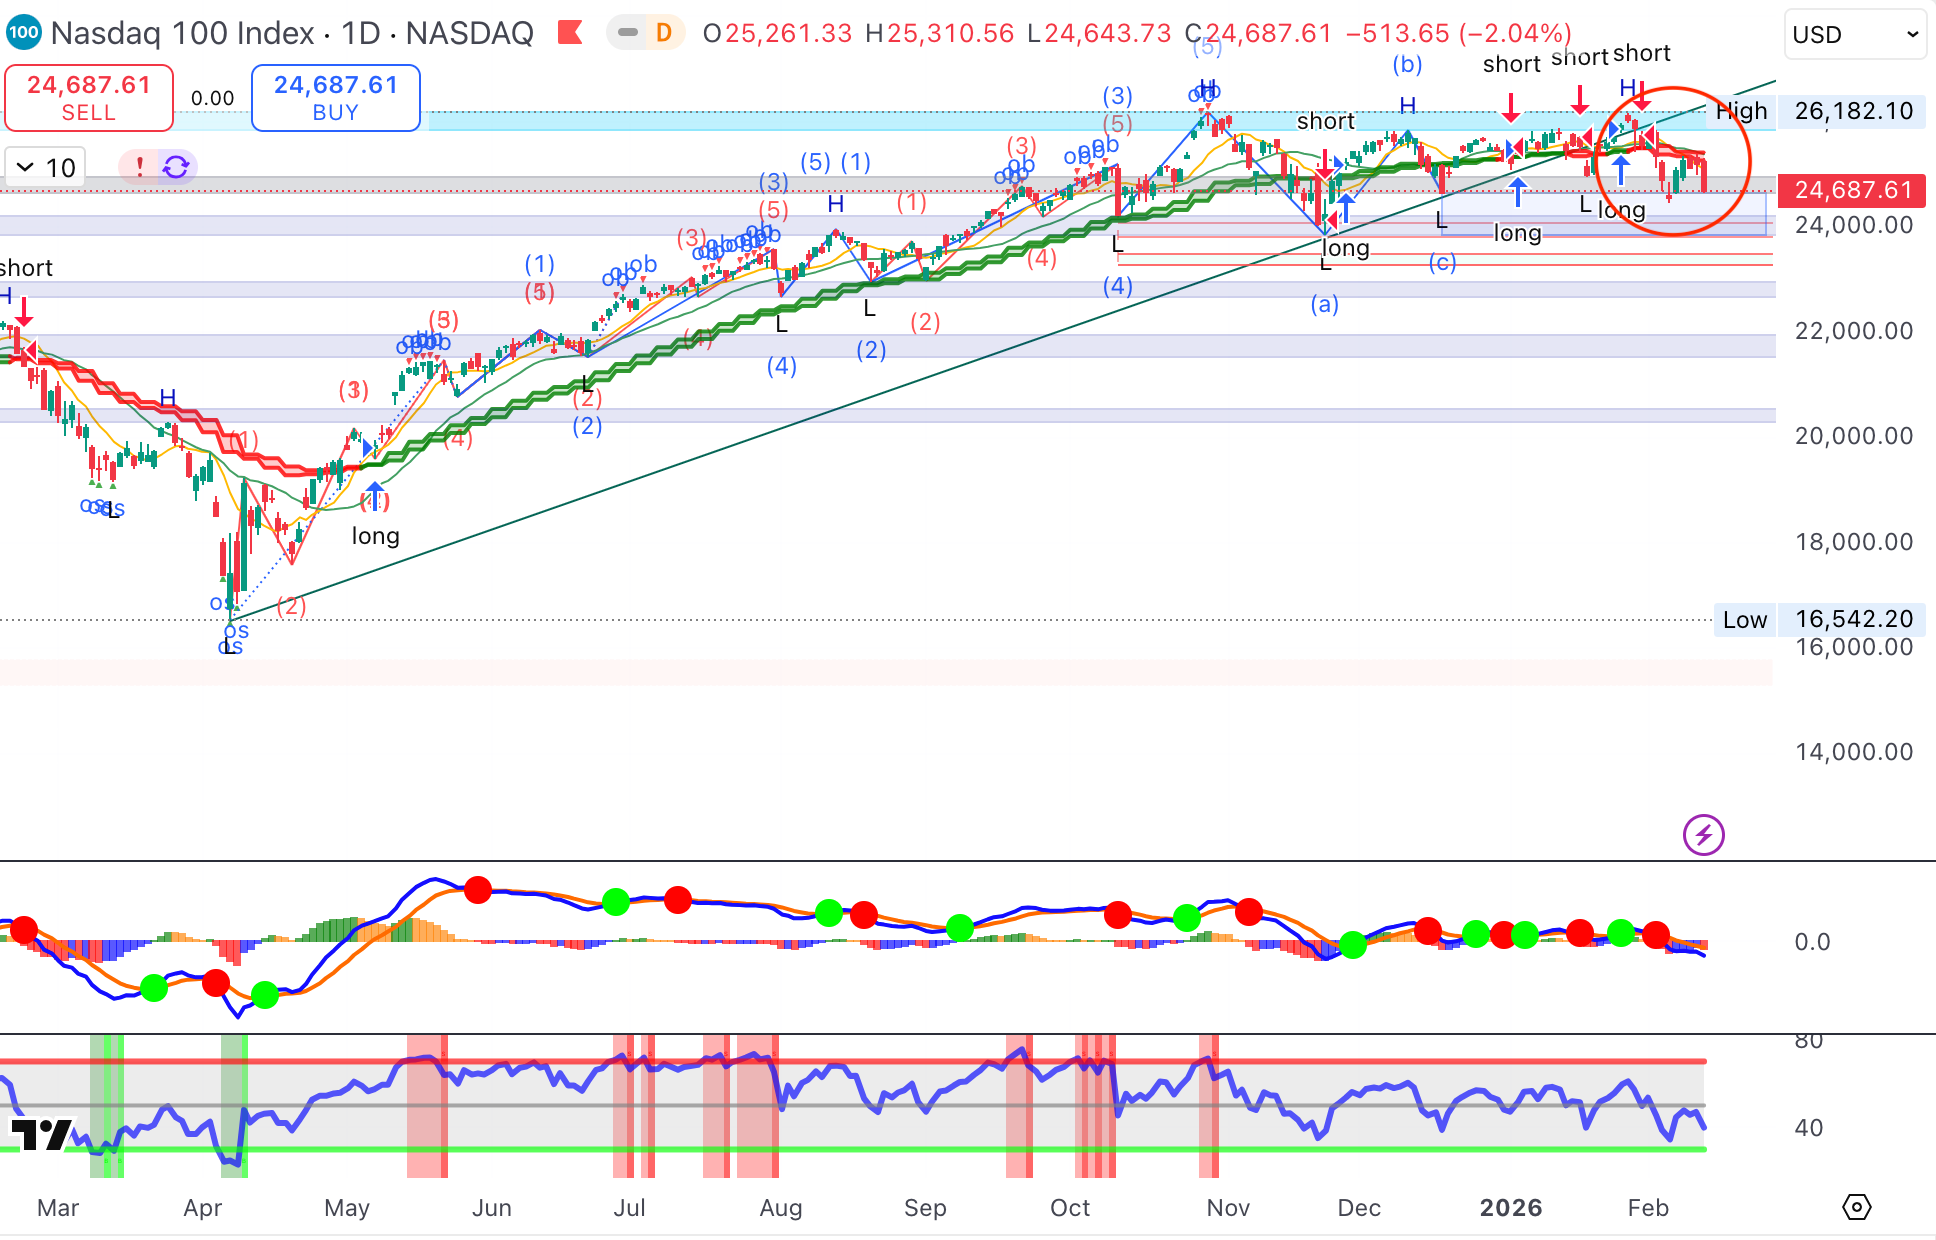
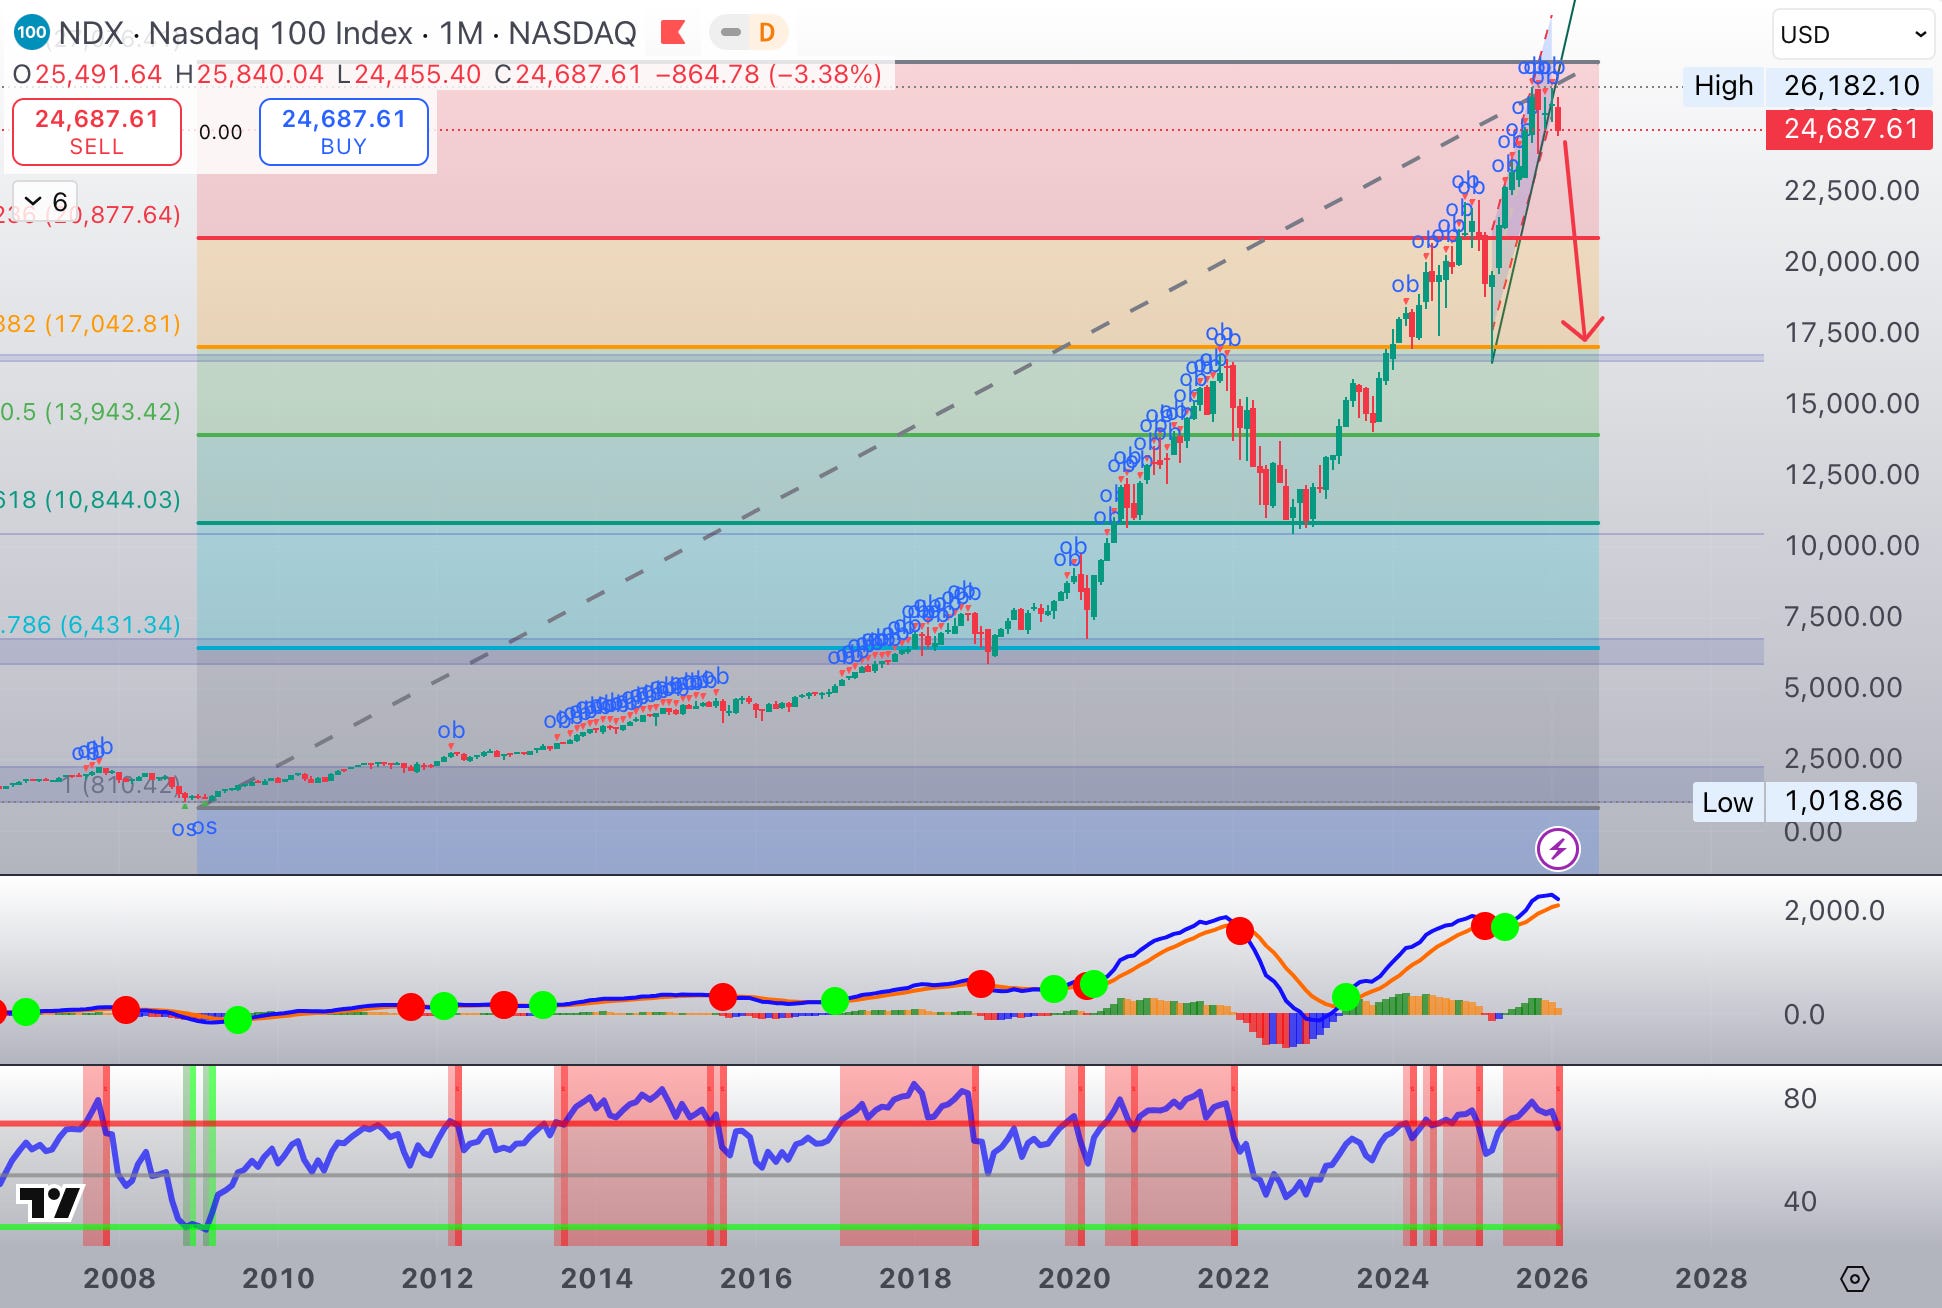
The Nasdaq 100 exploded +61%
This phase has been defined by:
Massive investor participation
Extreme index concentration
Unrestrained speculation
Valuations detached from historical reality
To put this into perspective:
The Nasdaq 100 recently traded at 7x sales, versus a long-term average of 3.22x
This is not expansion.
This is exhaustion.
What Comes After the Peak
The completion of these secular tops would logically mark the beginning of a SECULAR BEAR MARKET, potentially lasting a decade or more.
Such phases historically produce:
Deep, violent drawdowns
Structural destruction of over-valued market leaders
A repricing not of earnings, but of expectations
Given today’s extreme levels of:
Margin debt
Passive indexation
Retail and foreign investor participation
…the first wave of decline should not be gradual.
If history is any guide, It should be brutal.
The Market Is Sending Red Alerts
Over the past few weeks, markets have begun flashing unmistakable warning signals:
Individually, Mega-cap Tech and AI leaders have completed their peaks
Assets traditionally considered uncorrelated are collapsing simultaneously
We are witnessing violent dislocations across the board:
Bitcoin: down 48% since February
Gold: down 22% in two days
Silver: down 48% in two weeks
Microsoft: down 30% since January
Palantir: down 38 % since its peak
This is not rotation.
This is liquidation.
The Diagnosis: A Liquidity Heart Attack
When safe havens (gold) and risk assets (crypto, tech equities) collapse in perfect unison, the market is delivering a single, unmistakable message:
Liquidity has seized.
We are witnessing a stealth financial heart attack inside the U.S. system.
Somewhere in the shadow banking ecosystem — most likely within Commercial Real Estate and Private Credit — a leverage chain has snapped.
Margin calls are propagating.
And markets obey one immutable rule.
The Rule of the Margin Call
Institutions do not sell what they want to sell.
They sell what they CAN sell.
Illiquid assets — private credit, real estate, structured products — cannot be unloaded quickly.
So liquidity is raised by selling:
Gold
Bitcoin
Mega-cap equities
And Index constituents
This is why the strongest, most liquid assets fall first.
Why 7002.28 Matters
We now stand precisely at this junction.
The psychological milestone has been reached.
Momentum has rolled over.
Liquidity stress is spreading.
And recent price action has already demonstrated a critical truth:
Even the deepest markets — gold, mega-cap equities, major indices — can lose 30–40% of their value in a matter of weeks.
It happened in March 2020 under different circumstances.
It can happen again — even if most investors believe it cannot.
History is rarely kind to consensus.
The Technical Warning Signs
Markets rarely collapse without first issuing warnings.
They whisper before they scream.
What makes the current setup particularly dangerous is that multiple, independent technical signals are now converging — across timeframes, asset classes, and market structures.
This is not a single indicator flashing amber.
This is a dashboard lighting up red.
Over recent weeks, we have consistently argued that markets were operating in a technical no-man’s land — the narrow and unstable zone between the peak itself and the confirmation of that peak.
This distinction is critical.
A market peak is a process, not a single price print.
Confirmation only comes with the violation of major technical support levels.
In recent days, U.S. equity markets have taken that next step.
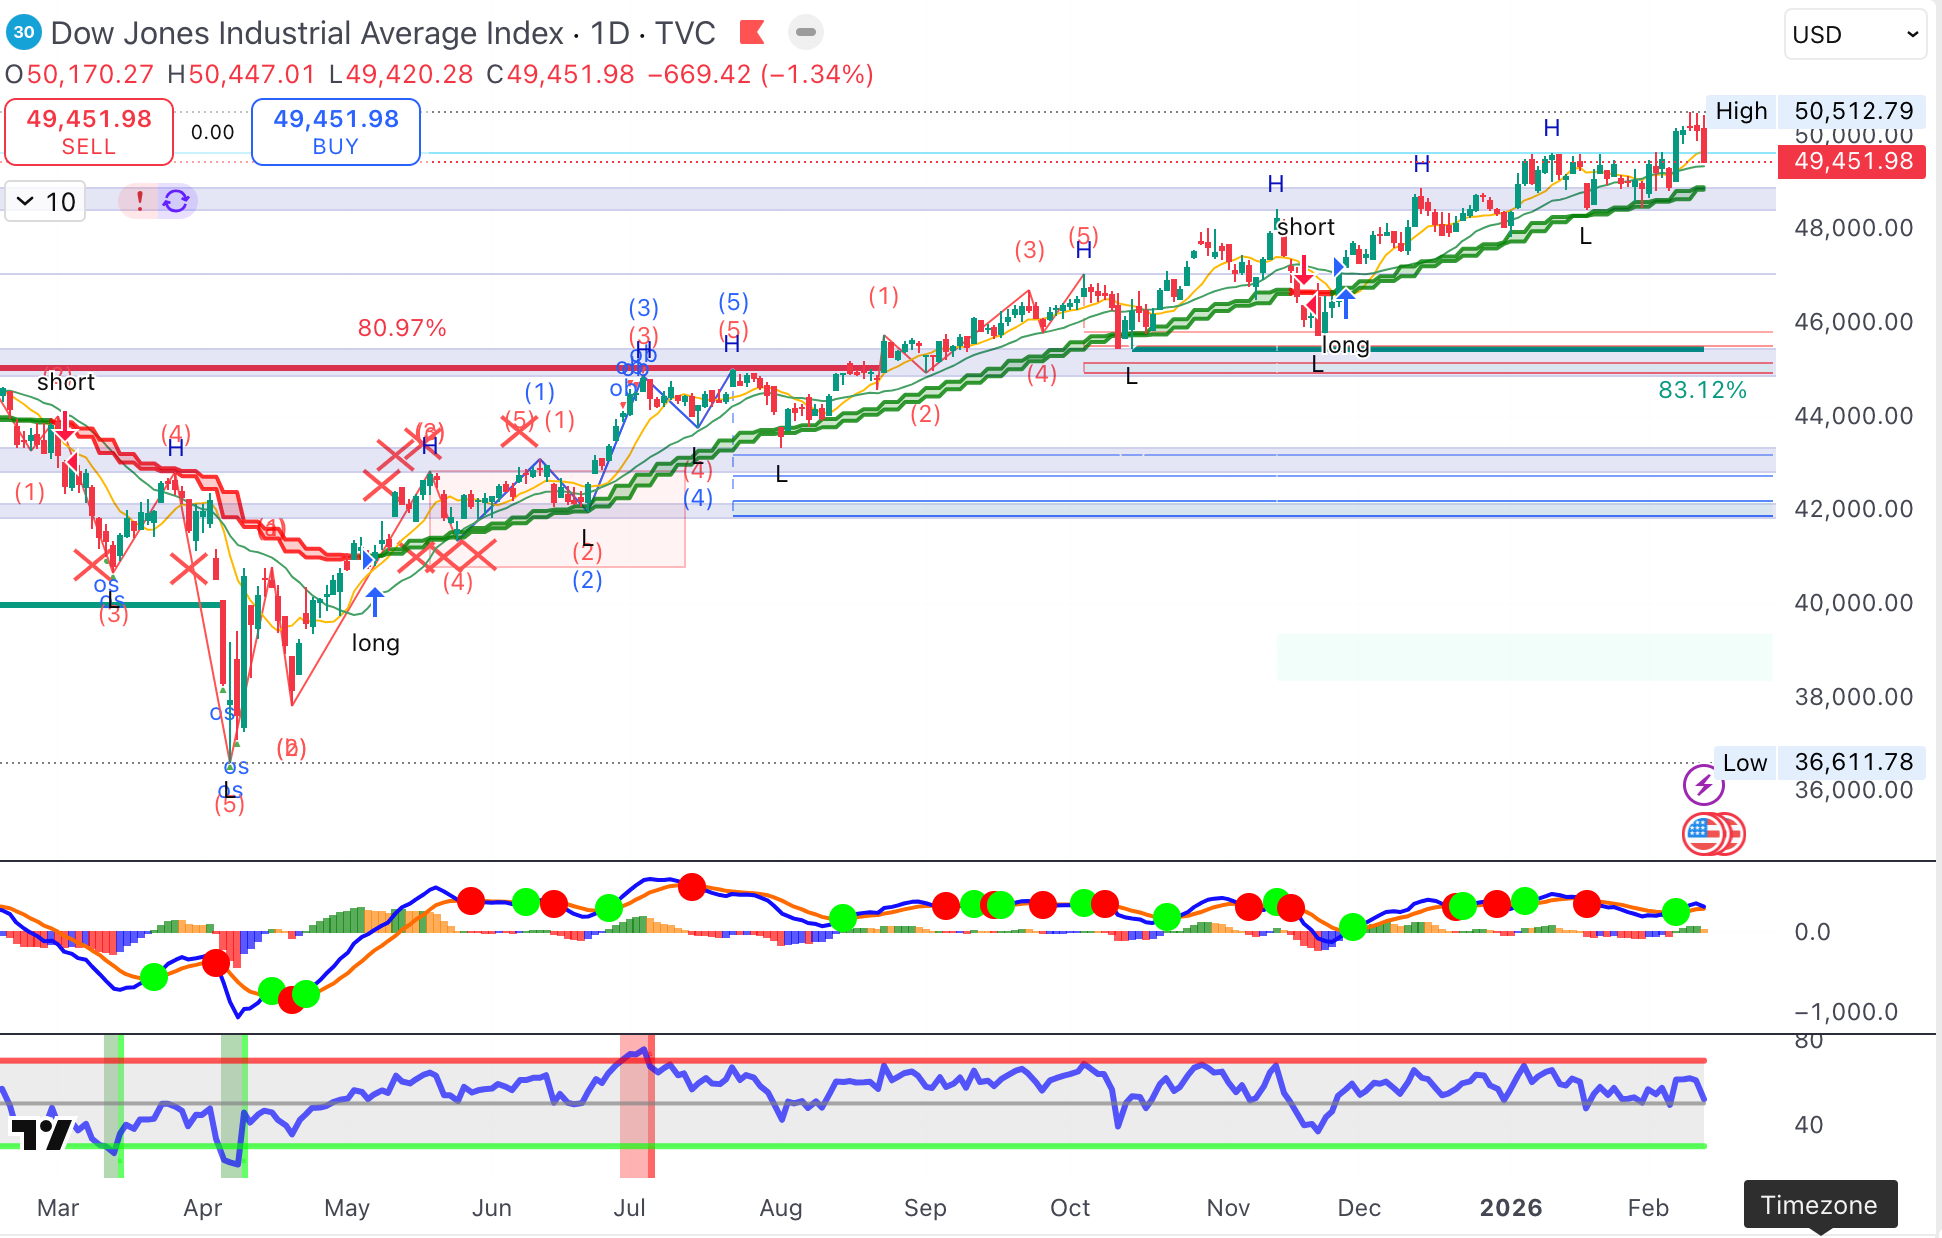
The major U.S. indices have now:
Confirmed their downtrends
Delivered broad-based SELL signals
Momentum has shifted decisively.
The next phase — and by far the most dangerous — is the break of key support levels.
This is the point at which:
Momentum traders engage
Systematic strategies flip short
Algorithms and hedge funds press downside exposure
Forced liquidation accelerates
This is where declines stop being discretionary and become mechanical.
And once this phase begins, markets rarely slow down — they cascade.
The mainstream indexes are completing their tops as well
Other technical warning signals
1. Ending Diagonal Completion at the Index Level
From a pure Elliott Wave perspective, U.S. equities are completing a terminal ending diagonal — a pattern that only appears at the exhaustion point of major bull markets.
These structures are characterised by:
Overlapping waves
Diminishing upside momentum
Increasing volatility near the highs
False breakouts and sharp intraday reversals
The brief push above 7,000 followed by immediate rejection is textbook behaviour for a terminal wave.
Ending diagonals do not resolve sideways.
They resolve violently.
2. Negative Momentum Divergences Across All Timeframes
Despite fresh nominal highs earlier this year:
RSI
MACD
Rate of Change
have all been making lower highs on daily, weekly, and in some cases monthly charts.
This is a classic sign of buying power exhaustion.
Price may still rise marginally, but the force behind the move is gone.
Historically, when weekly and monthly divergences align, the subsequent decline is not corrective — it is structural.
3. Market Breadth Has Already Broken
One of the most reliable early warnings of major tops is breadth deterioration.
Today:
New highs are increasingly driven by a shrinking group of mega-cap stocks
The majority of constituents have already rolled over
Advance/decline lines peaked months ago
In other words, the index is being held up by a handful of names, while the internal market is already in decline.
This is not strength.
This is fragility.
4. Volatility Is Rising While Prices Stall
Another classic pre-crash signature is the divergence between price and volatility.
We are now observing:
Rising implied volatility
Increasing intraday swings
More frequent downside gaps
…despite indices still trading near their highs.
This reflects growing stress in options markets and dealer hedging activity — often a precursor to forced deleveraging.
5. Correlation Breakdown Signals Liquidity Stress
Perhaps the most ominous technical signal is the sudden convergence of correlations.
Assets that should not move together are now doing exactly that:
Gold and equities falling together
Crypto and tech selling off in sync
Defensive assets failing to hedge risk
Correlation spikes of this nature historically occur only during liquidity events, not during normal market corrections.
When everything starts moving together, it means one thing:
Cash is being raised at any price.
6. The Speed of the Declines Is the Message
Finally, it is not just that markets are falling — it is how fast they are falling.
Multi-standard-deviation moves
Vertical drops in traditionally deep markets
Repeated “air pockets” in price
These are the fingerprints of forced selling, not discretionary reallocation.
Markets are no longer being driven by valuation or narrative.
They are being driven by risk limits and margin constraints.
Brace! Brace!
There are now too many flashing red lights across markets for investors to ignore.
At this stage of the cycle, attempting to extract one last incremental upside from an already overextended market is not conviction — it is the worst possible risk-reward trade.
Upside is limited.
Downside is open-ended.
After three consecutive years of exceptional performance, and following what has become the longest and most extended bull market in modern history, the rational response is not bravado.
It is prudence.
Taking profits.
Reducing exposure.
Raising cash.
This is not market timing.
This is risk management.
It is precisely what asset allocators are paid to do — at least in theory.
In practice, FOMO almost always interferes.
It pushes investors to remain fully invested when risk is highest, and to capitulate only after losses have already materialised.
Markets do not punish caution at cycle extremes.
They punish complacency.
The Downside Risk ( any time in the coming days / weeks)
SP500 Index :
3’900 - 3’500 target zone for the first leg down ( -45 %)
Nasdaq 100 Index :
17’000 - 14’000 target zone for the first leg down ( -45 %)
but 11’000 ( - 66 % ) cannot be excluded considering the exceptional level of concentration in a very small number of mega caps leaders.
Why the First Leg Is Usually Extremely Brutal
Market collapses are rarely smooth.
They begin with shock.
The first leg down is almost always the most violent phase of a bear market — not because fundamentals suddenly deteriorate, but because positioning is wrong.
At major cycle tops, investors are not defensively positioned.
They are maximally exposed.
Support Breaks Are Non-Linear Events
Markets do not move linearly once major support levels are breached.
Up to that point, price action is still governed by discretion — investors choosing to reduce exposure, rebalance portfolios, or hedge risk. Liquidity, while thinning, remains available.
Once support breaks, the market changes regime.
Support levels are not just lines on a chart.
They are risk management triggers embedded deep inside the market’s plumbing.
They sit inside:
Algorithmic trading systems
CTA and trend-following models
Volatility-targeting strategies
Risk-parity and systematic funds
Prime-broker margin frameworks
When these levels give way, selling is no longer a choice.
It is automatic.
From Selling Pressure to Selling Vacuum
The first consequence of a support break is not more sellers — it is fewer buyers.
Liquidity providers widen spreads.
Dealers reduce inventory.
Bid depth collapses.
Prices do not fall because everyone wants out.
They fall because no one is left to step in.
This is how orderly pullbacks turn into air pockets.
Mechanical Feedback Loops
Once downside momentum is established, feedback loops begin to reinforce each other:
Falling prices increase volatility
Higher volatility forces position reductions
Position reductions accelerate price declines
Declines trigger additional margin calls
Each loop feeds the next.
This is how markets transition from correction to liquidation event.
Why Index-Level Declines Accelerate
In modern markets, index construction amplifies these dynamics.
Because:
Capital is concentrated in a small number of mega-cap names
Passive flows dominate price formation
Index derivatives drive hedging behaviour
…selling pressure becomes self-referential.
As index levels fall, hedging flows increase.
As hedging flows increase, index constituents are sold indiscriminately.
This is why even the most liquid stocks can fall faster than fundamentals justify.
Speed Is Not an Anomaly — It Is the Signal
When markets begin to move at unnatural speed, this is not a malfunction.
It is the signal itself.
Rapid declines are the market revealing that liquidity has vanished, not that valuation has suddenly changed.
History is unambiguous on this point:
1987
2008
2020
Crashes do not begin with panic.
They begin with support breaks.
What Comes Next
We are now approaching — and in some cases already testing ( Nasdaq ) — those critical levels.
Once they fail decisively, markets will not wait for confirmation.
They will price it in immediately.
And when that happens, the move will feel sudden — but it will not be a surprise.
It will simply be the final phase of a process already in motion.
Have a great weekend.